Showing posts with label WAIS-IV. Show all posts

Saturday, July 1, 2017

"Intelligent" intelligence testing with Wechsler Arithmetic test

This article is a good reminder that "intelligent" intelligence testing requires "knowing thy subtests."

The authors conclude "In summary, while Arithmetic may be considered a measure of concentration or working memory, it should be kept in mind that many other factors influence it and that its specificity as a concentration measure is limited."


- Posted using BlogPress from my iPad

Monday, June 15, 2015

WAIS-IV US/Canadian norms controversy---articles for readers to review


I previously provided an FYI post on a hot topic in Canada...claims that the new WAIS-IV Canadian norms were flawed.  There are now three articles outlining the different arguments.  The three articles, published in JPA, can be found here, here, and here.

I continue to not comment on this controversy given my obvious conflict of interest as a coauthor of the competing WJ-IV.

Kevin McGrew

Thursday, July 31, 2014

WJ IV update: Correlations of WJ IV COG g-scores (GIA,Brief,Gf-Gc composite) and WISC-IV/WAIS-IV FS and GAI IQ scores

In the WJ IV technical manual (McGrew, LaForte, Schrank, 2014) concurrent validity results are presented for the WJ IV COG with the WISC-IV and WAIS-IV (click here for WJ IV COG overview and select correlation information from tech. manual).

A number of psychologists have asked about correlations between the primary WJ IV COG g-scores and the Wechsler General Ability Index (GAI).  They are not presented in the technical manual.  I have now computed those correlations, as well as a few others with the Wechsler GAI, and they are now part of the SlideShare at the link above and are also reported below.  Click on image to enlarge.


Tuesday, June 25, 2013

Factor structure of the WAIS-IV/WMS-IV: A CHC interpretation

A nice cross-battery CFA of the WAIS-IV and WMS-IV. Also, this article provides a nice historical overview of the changes of the two linked batteries over time. [Click on images to enlarge].

I would put a CHC theory spin on the validated factors. Verbal Comp = Gc; Perceptual Reasoning (Gf/Gv blend); Working Memory (Gsm...or what I know think should be labeled Gwm); Processing Speed (Gs), and Delayed Memory (Glr).


- Posted using BlogPress from my iPad

Monday, June 17, 2013

Error in Dr. James Flynn's (2009) WAIS-IV norming date: Quest blog post by Dr. Dale Watson


This is a guest blog post by Dr. Dale Watson.  The opinions expressed do not necessarily reflect the official position of the ICDP blog or the blogmaster.  However, it is of interest to note that the error Dr. James Flynn (2009) made in reporting the WAIS-IV norming date (here reported by Dr. Dale Watson) is true, and was also in a published review that I received a few days after I received Dr. Watson's guest post.  This second verification source (Kaufman, Dillon, & Kirsch, 2013) will be the subject of my next post.

Dr. Dale Watson's guest post 


In an article entitled, The WAIS-III and WAIS-IV: Daubert motions favor the certainly false over the approximately true, Dr. James Flynn analyzed data from a number of IQ tests, including the WAIS-R, WAIS-III, and WAIS-IV to estimate the rate of the “Flynn Effect” on the Wechsler scales in the U.S. over time.[i] He concluded, as have others, that in order to account for the obsolescence of aging IQ test norms, a “Flynn Effect” adjustment of 0.30 points per year from the date of a tests norming should be applied to the obtained IQ test scores (Flynn, 2009; Fletcher et al., 2010). For example, if the WAIS-III (normed in 1995) was administered to an individual in 2005, the obtained IQ should be downwardly adjusted by 0.30 x 10 or 3.0 points. Thus, an obtained IQ score of 72 would result in a Flynn-adjusted score of 69. Such adjustments have been recommended for use in Atkins evaluations (Flynn, 2009; Gresham & Reschly, 2011; cf Hagen et al., 2010).[ii]

Flynn compared the IQ scores obtained on the WAIS-III and the WAIS-IV in a sample of 240 examinees reported in the Technical and Interpretive Manual for the WAIS-IV (2008).[iii] The Technical Manual reported that the mean IQs differed by 2.9 points with the sample mean for the WAIS-IV being 100 and for the WAIS-III 102.9 (Wechsler, 2008, p. 75). However, because these IQ scores were calculated using different combinations of subtests, Flynn re-calculated the IQ scores utilizing the same combination of 11 subtest scores used on the WAIS-III to calculate the IQs. Flynn (2009) noted, “The list of subtests used to compute Full Scale IQ had not only changed, but had dropped from 11 to 10. But, once again, they gave the comparison group all 11 of the old WAIS-III subtests, and once again that was fortunate because it meant that the true obsolescence of the WAIS-III could be measured. I calculated the total standard score the group got on the same 11 WAIS-III and WAIS-IV subtests. Using the totals and the WAIS-III conversion table, I calculated Full Scale IQs for the two tests” (p. 102). 

In examining Flynn’s Table 2, it appears that these calculations included scores for the Picture Arrangement subtest for both the WAIS-III and WAIS-IV. However, the Picture Arrangement subtest is not included in the WAIS-IV so it is quite unclear how this calculation was performed. Moreover, there is a footnote to this table indicating that the “WAIS-IV estimate is eccentric in carrying over WISC-III subtests (and scoring vs. the WAIS-III tables)…” but the meaning of this statement is also uncertain. In addition, substitution of the Symbol Search subtest for Picture Arrangement appears to yield very similar results.

In any case, the point of this note is not to recalculate Flynn’s estimates but rather to point out what appears to be a discrepancy between WAIS-IV norming date provided by Flynn and that found in the Technical and Interpretive Manual for the WAIS-IV. Flynn indicated that the WAIS-IV was normed in 2006 (Table 1) whereas the Manual reported, “The WAIS-IV normative data was established using a sample collected from March 2007 to April 2008.” [iv] If we use 2007 as the mid-point norming date, the time between the norming of the WAIS-III and WAIS-IV is 12 years and not 11 as provided by Flynn. Using the Flynn 2006 date resulted in a calculated Flynn Effect between the WAIS-III and WAIS-IV of 0.306 points per year (+3.37 / 11 years). Using the norming date provided in the manual resulted in a calculated score of 0.281 points per year (+3.37 / 12 years). It is understood that this discrepancy of just 0.025 points is of little practical significance but it should be noted nonetheless. Moreover, the metaphorical splitting of hairs is not uncommon when discussing the Flynn Effect. Hagan et al. (2010) asserted, “Decades of FE research and testimony… depict the amount of this shift as a moving target. For example, Flynn (1998) once identified the annual shift as 0.25 rather than 0.30, but later testified in Ex Parte Eric Dewayne Cathey (2010) that 0.29 would be appropriate. Schalock et al. (2010) have called for an annual adjustment of 0.33” pp. 1-2.[v] Flynn has acknowledged that the results reported in his report are estimates for the Wechsler scales, writing, “It is quite possible that the rate of gain on Wechsler tests is 0.275 or 0.325 points per year” (Flynn, 2009, p. 104). The recalculation noted here is consistent with this judgment. Further, the weight of the available evidence, including that of a recent meta-analysis, continues to support the Flynn Effect adjustment of 0.3 points per year.[vi]


[i] Flynn, J. R. (2009). The WAIS-III and WAIS-IV: Daubert motions favor the certainly false over the approximately true. Applied Neuropsychology, 16(2), 98-104. doi: 10.1080/09084280902864360
[ii] Gresham, F. M., & Reschly, D. J. (2011). Standard of practice and Flynn Effect testimony in death penalty cases. Intellectual and Developmental Disabilities, 49(3), 131-140. doi: 10.1352/1934-9556-49.3.131
[iii] Wechsler, D. (2008). Wechsler Adult Intelligence Scale: Technical and interpretive manual (4th ed.). San Antonio, TX: Pearson.
[iv] Id., p. 22.
[v] Hagan, L. D., Drogin, E. Y., & Guilmette, T. J. (2010). IQ scores should not be adjusted for the Flynn Effect in capital punishment cases. Journal of Psychoeducational Assessment, 28(5), 474-476. doi: 10.1177/0734282910373343
[vi] Fletcher, J. M., Stuebing, K. K., & Hughes, L. C. (2010). IQ scores should be corrected for the Flynn Effect in high-stakes decisions. Journal of Psychoeducational Assessment, 28(5), 469-473. doi: 10.1177/0734282910373341

Friday, May 17, 2013

Video tutorial: Estimating latent WISC-IV and WAIS-IV scores for individuals--Dr. Joel Schneider

Dr. Joel Schneider has done it again.  A brilliant video tutorial demonstrating how latent factor scores can be used, via Excel templates he provides, to interpret scores on the WISC-IV and WAIS-IV.  This is complex material but his beautiful visual video tutorial makes it easier to understand the complex constructs.  Dr. Schneider continues to push the envelope on psychometric based IQ test score interpretation.


Sunday, January 27, 2013

Research Byte: Which is better measure of intelligence? WAIS-III or WAIS-IV

A new article comparing the changes from the WAIS-III to the WAIS-IV with implications for Atkins cases by Taub and Benson. Below is the abstract. Dr. Taub can be contacted via this link.

A previous IAP AP101 report dealing with WAIS-III/WAIS-IV structural changes is worth reading when reviewing this current article.


Sunday, November 18, 2012

AP 101 Brief # 17: Misunderstanding and misuse of achievement test scores in Atkins MR/ID death penalty cases: Part 1--Range of expected standard scores


AP 101 Brief #17:  Misunderstanding and misuse of achievement test scores in Atkins MR/ID death penalty cases:  Part 1 -- Range of expected standard scores

Kevin S. McGrew, PhD.
Institute for Applied Psychometrics (IAP)


Individually administered comprehensive intelligence tests (IQ) demonstrate strong and significant correlations with individually administered achievement tests (ACH).  However, the magnitude of the IQ/ACH correlation is not at the level that allows for precise prediction of expected achievement for individuals.  Unfortunately, many educators, lay persons, and psychologists have a false understanding of the IQ/ACH relationship—what I call the IQ-ACH fallacy.  The IQ-ACH fallacy can be misunderstood and misused in the diagnosis of MR/ID.  The goal of this IAP Applied Psychometrics Brief report (which will be a 2 or 3 part series) is to educate professionals and non-professionals on the scientific evidence regarding IQ/ACH relations.  The focus is on Atkins MR/ID contexts, but the information is relevant to all situations where IQ and ACH test scores are compared.  I have previously written about this topic at the ICDP blog (that prior post may be worth reading before reading the rest of the current brief report - Can a mild MR/ID person fail to be formally diagnosed before the age of 18? Do Forrest Gump's exist?)

What is the typical correlation between IQ and achievement test scores?

First, what is the typical correlation between measured IQ and ACH?  I have frequently seen a value of .50 referenced for adult populations and values from .60 to .65 for school-age populations.  I decided, given that most IQ tests have been revised as per contemporary neurocognitive and psychometric (CHC theory) research during the past 25 years, that these correlations needed to be re-verified or revised. 
  
Given the current focus on adult forensic settings (Atkins cases), I turned to the WAIS-IV technical manual.  Table 5.13 (page 87) reports correlations between the WAIS-IV scales and achievement scales from the WIAT-II in a sample of 93 subjects.  The WAIS-IV FS IQ correlated .76, .84, and .65 with the WIAT-II Reading, Mathematics, and Written Language Composites.  Given the small sample size of this validity study (n = 93), I, as a coauthor of the WJ III, was able to access the norm data of the WJ III Battery (NU norms) and calculated the correlation between the WJ III NU General Intellectual Ability—Standard (GIA-Std) and the WJ III NU Broad Reading, Math, and Written Language clusters in adults from ages 20 thru 45 (sample sizes ranged from 733 to 751 subjects).  Correlations were .74, .68, and .71 between the WJ III GIA and WJ III Broad Reading, Math, and Written Language clusters.  These WJ III IQ/ACH correlations were similar to those for the WAIS-IV/WAIT-III ACH correlations.  Taking all six correlations together, I calculated the average (median) value which was approximately .75.  This .75 value is much higher than the typical .50 to .65 values often cited in the literature.  It is my conclusion that contemporary IQ batteries (e.g., WAIS-IV, WISC-IV, WJ III, Stanford-Binet IV) are better predictors of ACH (than their earlier counterparts) and the typical IQ/ACH correlation used in adult (Atkins) settings should be approximately .70 to .75.

When predicting ACH scores from IQ scores, how much error in prediction is present?

Given that the most common IQ/ACH analysis is to determine if a person’s measured ACH scores are within the expected range for a person’s measured IQ, I next calculated the Standard Error of Estimate (SEest) for each of the six correlations measured above (ranged from 8.2 to 11.4).[1]  In simple terms, when using a specific correlation between two variables to predict one variable from the other, there will be error in the prediction.  More importantly, this error, just like the SEM around a single score, is in the form of a normal distribution with a mean (zero is the average or mean IQ/ACH expected differences) and standard deviation of predicted/expected scores.  This SD of expected or predicted scores is the SEest.  I then calculated the median SEest of these six values and obtained a value of 9.15 points, which I rounded to 9 points (for ease of computation and discussion). 

An SEest of 9 means that for any specific IQ score there is an expected/predicted score that has a 68% confidence band of prediction of + 9 points (from 9 points lower to 9 points higher than the expected/predicted score).  The 95% prediction confidence band is twice the 68% value—18 points.  Thus, if one wants to use a 95% confidence band, which has become the accepted standard of precision in life or death Atkins cases, then a person’s expected/achievement achievement score needs to be bounded by a range of scores from 18 points lower to 18 points higher—a span of 36 standard score points!

What is the range of expected/predicted achievement scores (in standard scores) for a person with an IQ of 70?

For illustrative purposes, I took an IQ score of 70 as a hypothetical person’s measured IQ.  Using the IQ/ACH correlation of .75 (and assuming both the IQ and ACH score are on a standard score scale with M = 100, SD = 15), I then calculated an expected/predicted ACH score, a calculation that must take into account the phenomena of regression to the mean (see Cahan et al., 2012 for detailed discussion of history and critical analysis of IQ-ACH regression procedures).   This calculation is of the form [(IQ-100) x IQAch r] +100.  Thus, [(70-100) x .75] +100 = 77.5 (rounded to 78 for discussion purposes).  Thus, for a person with an IQ of 70, the best single point estimate of their expected achievement is a standard score of 78.

This expected/predicted score of 78 must now be bracketed with the 95% SEest (+ 18).  This produces a 95% confidence band of expected/predicted ACH standard scores from 60 to 96!  This means that individuals with mild MR/ID (in this case IQ = 70) can obtain achievement standard scores well below their measured IQ score (with 95 % confidence down to as low as 60).  More importantly, and often misunderstood and misused in MR/ID determination, individuals with mild MR/ID (defined here as an IQ of 70) can, when using a 95% prediction confidence band and accounting for regression to the mean effects, obtain ACH standard scores up in the normal range (low average).  Of course, most expected/predicted achievement scores will bunch around the point-specific predicted score of 78 in the same manner that scores bunch around the mean in a normal curve.)  

Thus, ACH standard scores (based on a psychometrically sound individually measured ACH test) can be significantly higher than an individual’s IQ score, due to the less than perfect correlation between IQ and ACH.  For further explanation and detail review see McGrew and Evans (2004).  The presence of ACH test standard scores above a person’s measured IQ score, when that IQ score is in the mild MR/ID range, should not be used as clear and reliable evidence that the person is not MR/ID.  The IQ-Ach fallacy does not allow for such conclusions.  The only scientifically sound interpretation is that assuming that IQ/Ach test correlate at approximately .75, after the best regression-to-the-mean expected/predicted score is calculated, this score must be bounded by a range of standard scores 18 points lower and 18 points higher (95% confidence band of prediction/estimation).

Summary

            The essence of the above information is summarized in the figure below.  [Click on the figure to enlarge]


What about the range of expected grade equivalents?

            In the next installment of this series, the above hypothetical scenario will be presented in the form of range of expected (95% confidence) grade equivalent (GE) scores.  Given the unequal interval characteristics of GE’s and the non-linear growth curves of cognitive and achievement abilities, the results may shock many professionals and non-professionals.  Stay tuned.


[1] A brief description and the relatively simple formula for calculating the SEest is available in Anastasi and Urbina (1997).

Friday, July 6, 2012

Research byte: WAIS-IV Visual Puzzles study

Click on image to enlarge


Posted using BlogPress from Kevin McGrew's iPad
www.themindhub.com

Monday, April 2, 2012

CHC theory and the Wechsler IQ scales and test development and interpretation

In 1998 Dr. Dawn Flanagan and I published the Intelligence Test Desk Reference book which was the first thorough treatment of CHC theory (then called Extended Gf-Gc theory). This book is now out-of-print.


We then took the concepts from the ITDR and, together with Dr. Sam Ortiz, presented a cross-battery approach to interpreting the Wechsler batteries.


And again, this book is no longer in print. This also means we no longer receive any $ for sales (conflict of interest disclosure). Table of contents for first three chapters below (click on images to enlarge)


The research, theory, and conceptual material in the second book is nearly identical to the first, but it was presented in the context of how to upgrade interpretation and understanding of the Wechsler batteries according to the CHC framework. Since then the same CHC overview material has been tweaked and updated in a series of CHC cross-battery books by Flanagan et al. But, the foundation of CHC theory, and how it can be integrated within a conceptual framework of test development and interpretation, is largely the same in these newer CHC cross-battery books.

Thus, given that these "mother and father" books are no longer in print, I took the liberty of copying the first three chapters of the Wechsler oriented book and am now making them available for my readers (click here). I make this material available to provide psychologists who have not done much reading regarding CHC theory an opportunity to have access to the basic foundation of CHC theory to help them see how it can be applied to the interpretation of an intelligence battery (in this case the Wechslers). By choosing the Wechsler material this also helps understand how the Wechsler batteries are evolving (either implicitly or explicitly--see Keith and Reynolds, 2010) when viewed from the lens of CHC theory.

But, one must recognize that this material is a bit dated. An update of CHC theory was later published in 2005 (click here to access...plus some other chapters), and was again updated this year by Schneider and McGrew (click here).

However, the CHC chapter I provide in this blog post, particularly when placed in the context of the Wechsler batteries, provides a solid foundation for understanding CHC theory and its impact on contemporary intelligence test development and interpretation. My goal is to increase awareness of CHC theory and its relevance to psychological assessment and interpretation. My goal is to spur others to become more current re: this now dominant framework in the field of applied IQ testing.


- Posted using BlogPress from Kevin McGrew's iPad

Wednesday, September 21, 2011

More support for CHC interpretation of the WAIS-IV


(double click on images to enlarge)

Yet another CFA study of the WAIS-IV standardization data that suggests the CHC framework is likely the most vablid interpretative framework for the WAIS-IV. Other posts in support of this conclusion can be found here and here.


Of particular note is the continued finding, consistent with my interpretation of the literature that the Arithmetic subtest is a factorially complex and mixed measure of 2-3 different CHC domains and thus, should NOT be interpreted as a strong indicator of any particular CHC domain. This does not mean it is a bad test. On the contrary, factorially complex tests are sometimes some of the best predictors of other outcomes because they measure multiple abilities (which makes them function as mini g-proxies). The point, reinforced by this latest study, is that Arithmetic is not a good strong indicator of a single CHC domain and has considerable construct irrelevant variance when interpreted within a CHC framework

Conflict of interest note - I am a coauthor of the WJ III which is a competitor to the WAIS-IV

- iPost using BlogPress from Kevin McGrew's iPad

Tuesday, June 28, 2011

Special issue of Assessment journal on the WAIS-IV and WMS-IV research


The journal Assessment just published a special issue on the WASI-IV/WMS-IV. I love the journal cover (see above)


Frazier, T. W. (2011). Introduction to the Special Section on Advancing WAIS-IV and WMS-IV Clinical Interpretation. Assessment, 18(2), 131-132.

Bowden, S. C., Saklofske, D. H., & Weiss, L. G. (2011). Augmenting the Core Battery With Supplementary Subtests: Wechsler Adult Intelligence Scale-IV Measurement Invariance Across the United States and Canada. Assessment, 18(2), 133-140.

Brooks, B. L., Holdnack, J. A., & Iverson, G. L. (2011). Advanced Clinical Interpretation of the WAIS-IV and WMS-IV: Prevalence of Low Scores Varies by Level of Intelligence and Years of Education. Assessment, 18(2), 156-167.

Drozdick, L. W., & Cullum, C. M. (2011). Expanding the Ecological Validity of WAIS-IV and WMS-IV With the Texas Functional Living Scale. Assessment, 18(2), 141-155.


Gregoire, J., Coalson, D. L., & Zhu, J. J. (2011). Analysis of WAIS-IV Index Score Scatter Using Significant Deviation from the Mean Index Score. Assessment, 18(2), 168-177.

Holdnack, J., Goldstein, G., & Drozdick, L. (2011). Social Perception and WAIS-IV Performance in Adolescents and Adults Diagnosed With Asperger's Syndrome and Autism. Assessment, 18(2), 192-200.

Holdnack, J. A., Zhou, X. B., Larrabee, G. J., Millis, S. R., & Salthouse, T. A. (2011). Confirmatory Factor Analysis of the WAIS-IV/WMS-IV. Assessment, 18(2), 178-191


- iPost using BlogPress from my Kevin McGrew's iPad

Generated by: Tag Generator


Friday, April 8, 2011

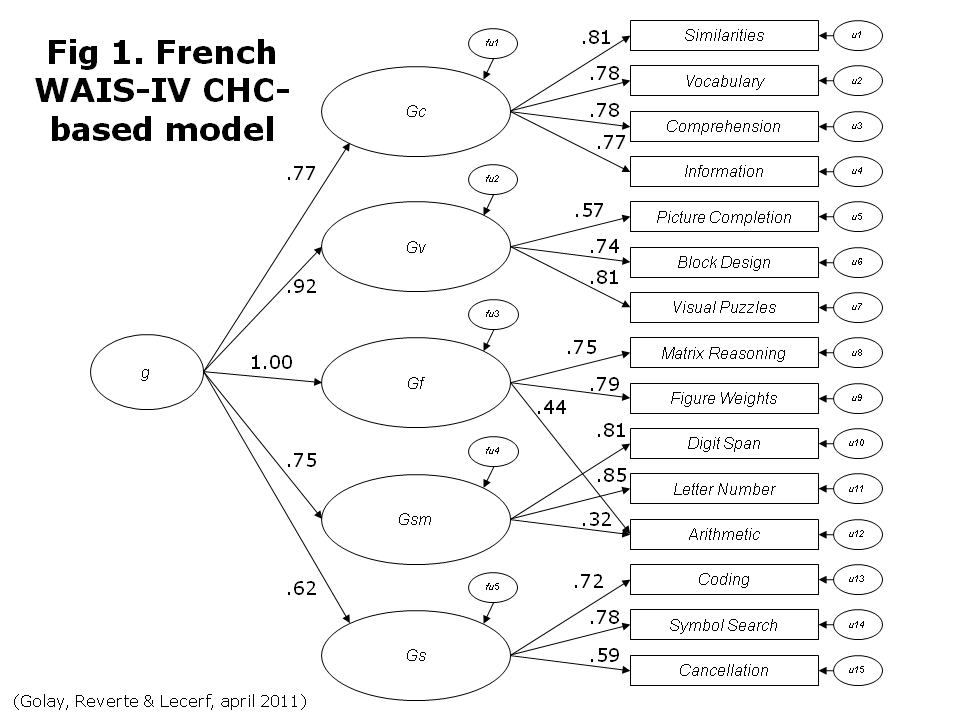
AP101 Brief #8 (guest brief): Independent CFA of the French WAIS-IV by Golay et al. (2011)


This IAP AP101 Brief Report was sent to me for posting by Philippe Golay.  It is reproduced "as is" with only minor editing.  This is a guest blog/brief report.  Figures included should be possible to enlarge by double clicking on them.

If other folks have completed research related to this blog, and would like to make brief post reports, please contact the blogmaster @ iap@earthlink.net


Philippe Golay, Isabelle Reverte, Thierry Lecerf,
University of Geneva, Switzerland

The fourth edition of the French Wechsler Intelligence Scale for Adult (WAIS-IV) was recently released (Editions du Centre de Psychologie Appliquée – ECPA, 2011). The French WAIS-IV was standardized on a representative sample of 876 people in France ranging in age from 16 to 79. However, for some subtests (Letter Number, Figure Weights and Cancellation), normative data were restricted to 730 participants (and from 16 to 69 years only). In the French WAIS-IV manual, confirmatory Factor analyses were reported, and models with 1, 2, 3 and 4 factors were presented. CFAs supported a factorial structure with 4 factors. Surprisingly, no models based on the Cattell-Horn-Carroll (CHC) theory were reported in the technical manual of the French WAIS-IV. Thus, the main goal of this VERY brief report is to provide a preliminary independent examination of the factor structure of the French WAIS-IV according to the CHC theory. Analyses were conducted on the basis of the subtest inter-correlation matrix and the standard deviations reported in the French manual (p. 50). We used the Akaike Information Criterion (AIC) to compare models.

In the first step, models based on the four-factors solution were tested: four-correlated factors (VCI, PRI, WMI, PSI) and a hierarchical model with four factors and one general factor. We also tested modified versions of the basic 4 factor models because they were suggested and reported in the technical manual. This variant included correlated error terms for Digit Span and Letter Number Sequencing, a cross-loading for Figure Weight on the WMI factor and a cross-loading for Arithmetic on the VCI factor. The model fit of both four factor models (with or without g) was greatly increased as a result. We also tested a bifactor model, in which all subtests scores directly load onto a general factor and also onto one first-order group factor. Results indicated that the bifactor “WAIS-IV” model fits better the data than the other WAIS-IV models.

In a second step, we tested a couple of CHC-based models. We retained a model (fig.1) in which Arithmetic loads both on Gsm and Gf but does not include a cross-loading for Figure Weight on the Gsm factor. This model was better than the basic four-factors WAIS model but slightly less adequate than both modified four-factors solutions. Finally, we tested a bifactor CHC-based model (fig.2). This model with 5 uncorrelated group factors and a first order g factor showed the best fit to the data. The results are summarized in figure 3.

These preliminary results indicated that CHC-based interpretation of the French WAIS-IV is also a valid alternative. Furthermore, bifactor models showed better fit to the data than their higher-order counterparts. This challenges a rather implicit but nevertheless strong assumption that the relationship between the general factor and each subtest is only mediated by the broad abilities.


Technorati Tags: , , , , , , , , , , ,

Sunday, February 20, 2011

Research brief: WAIS-IV US-Canadian factor and score comparability

The transportability of the meaning of an intelligence test batteries composite scores across countries/cultures is important when a test is originally developed and normed in one country and is then adapted and used in a second country.

Bowden et al (2010) recently investigated the factorial invariance of the WAIS-IV across US and Canadian samples. The results are summarized in the abstract below (click to enlarge). The WAIS-IV was found to measure the same theoretical constructs across the two countries. However, the reported difference in latent mean factor intercepts indicated that the WAIS-IV provides higher scores with Canadian subjects. The need for Canadian norms are suggested.


- iPost using BlogPress from my Kevin McGrew's iPad

Generated by: Tag Generator


Monday, January 31, 2011

IQ test "practice effects"

A practice effect is a major psychometric issue in many Atkins cases, given that both the state and defense often test the defendant with the same IQ battery (most often a Wechsler), and often within a short test-retest interval. Click here to view all ICDP posts that mention practice effects.

Dr. Alan Kaufman has summarized the majority of the literature on practice effects on the Wechslers. He published an article in The Encyclopedia of Intelligence (1994; Edited by Robert Sternberg) that summarized the research prior to the third editions of the Wechsler scales. That article is available on-line (click here).

The most recent summary of the contemporary Wechsler practice effect research is in Lichtenberger and Kaufman (2009) Essentials of WAIS-IV Assessment (p. 306-309). The tables and text provide much about WAIS-IV and some about WAIS-III. The best source for WAIS-III is Kaufman and Lichtenberger, Assessing Adolescent and Adult Intelligence (either the 2002 second edition or the 2006 third edition), especially Tables 6.5 and 6.6 (2006 edition). Below are a few excerpts from the associated text from the 2006 edition

"Practice effects on Wechsler's scales tend to be profound, particularly on the Performance Scale" (p. 202)

"predictable retest gains in IQs" (p.202)

"On the WAIS-III, tests with largest gains are Picture Completion, Object Assembly, and Picture Arrangement"

"Tests with smallest gains are Matrix Reasoning (most novel Gf test), Vocabulary and Comprehension

Block Design improvement most likely due to speed variance--"on second exposure subjects may be able to respond more quickly, thereby gaining in their scores" (p. 204)

One year interval results in far less pronounced practice effects (p. 208).

"The impact of retesting on test performance, whether using the WAIS-III, WAIS-R, other Wechsler scales, or similar tests, needs to be internalized by researchers and clinicians alike. Researchers should be aware of the routine and expected gains of about 2 1/2 points in V-IQ for all ages between 16 and 89 years. They should also internalize the relatively large gain on P-IQ for ages 16-54 (about 8 to 8 1/2 points), andn the fact that this gain in P-IQ swindles in size to less than 6 points for ages 55-74 and less than 4 points for ages 75-889" (p. 209).

"Increases in Performance IQ will typically be about twice as large as increases in Verbal IQ for individuals ages 16 to 54" (p. 209)


Finally, the latest AAIDD manual provides professional guidance on the practice effect.


"The practice effect refers to gains in IQ scores on test of intelligence that result from a person being retested on the same instrument" (p. 38)

"..established clinical practice is to avoid administering the same intelligence test within the same year to the same individual because it will often lead to an overestimate of the examinee's true intelligence" (p. 38).


- iPost using BlogPress from my Kevin McGrew's iPad

Generated by: Tag Generator